Copyright View the Space, Inc. 2026

METHODOLOGY


VTS Office
Demand Index
(VODI)

Quarterly Report
Get a pulse on what’s happening in the market today.

KEY TAKEAWAYS
NATIONAL TRENDS
LOCAL TRENDS
METHODOLOGY
COMPANY

April 2026
National
Local
KEY TAKEAWAYS FROM THIS REPORT

Top Performers: San Francisco, Los Angeles, and New York led office demand in the first quarter. San Francisco emerged as the top performer, with a 70% quarter-over-quarter rise in technology demand, fueled by AI. Its VODI of 114 is the only reading among tracked markets to surpass pre-pandemic levels. Los Angeles also gained ground, recording a 20% quarter-over-quarter increase in demand, driven by its core creative sector, though its VODI of 72 remains below the pre-pandemic average. New York's office demand continued to expand, registering a VODI of 91, reflecting a 17% quarter-over-quarter increase, propelled by the return of demand from the finance and legal sectors, which had softened over the previous twelve months.
PREVIOUS

Despite serious geopolitical and macroeconomic headwinds, the national office market had growth consistent with seasonal norms, with the VTS Office Demand Index (VODI) ending Q1 at its highest post-pandemic level. The VODI concluded the quarter at 79, up 18 percent quarter-over-quarter and 13 percent year-over-year. This performance occurred amid complex economic shifts and was driven by recent growth in three core office-using sectors: finance, technology, and legal, all of which posted double-digit demand gains quarter-over-quarter.
These gains come against a mixed macro backdrop. On the labor front, total office-using employment - a key driver of office demand, contracted by 0.5 percent year-over-year, a loss of 183,000 jobs. On a longer-term basis, office-using employment is down 2 percent since the emergence of generative AI in November 2022.


Learn more about VTS Data
See VODI Methodology

NEXT


Muted momentum with lack of growth driver:
Washington, D.C., Seattle, Chicago
Markets in Focus
Washington, D.C. recorded a VODI of 63. The market's demand was notably insulated from broader fluctuations, thanks primarily to growth in government requirements and stable professional services demand from the legal sector. This distinct demand structure has helped the capital mitigate some of the economic uncertainties resulting from the recent oil shock. Nevertheless, current demand remains significantly below pre-pandemic levels. The 2026 midterms may prompt tenants to delay decisions pending clarity on policy direction.
12 month change in VODI
PREVIOUS
Other Major Markets: Performance in other major office markets was varied. Boston’s VODI remained suppressed at 42, a figure that reflects a significant 31 percent year-over-year decline in tenant demand. Chicago, in contrast, experienced an 11 percent quarter-over-quarter dip, as demand from its core professional services, finance, and legal sectors was not enough to make up for declines in other sectors. Meanwhile, Seattle maintained strong annual momentum despite a moderating quarterly trajectory, indicating that while short-term demand growth declined, the year-over-year picture remains positive. Lastly, Washington, D.C.'s VODI dropped modestly quarter-over-quarter to 63 and remains well below pre-pandemic levels despite recent monthly gains from the legal and government sectors.
NEXT

Boston
Chicago
Los Angeles
New York
San Francisco
Seattle
Washington, D.C.


BOOK A DEMO

The VTS Office Demand Index (VODI) report is a free public-facing analysis based on VTS Data from the previous quarter, capturing office demand in the nation's seven gateway markets. Our VTS Data product includes comprehensive in-depth analytics of numerous benchmarks in over 30 markets across the U.S., the U.K., and Canada.
This report features analysis from the VTS Research and Public Relations teams, including Rene Moreira, Max Saia, and Eric Johnson. For more information on what VTS Data can provide you, please connect with our team below.


Boston's performance lagged the national index, finishing the quarter at a VODI of 42, the lowest of the major VODI markets. The market faced notable annual declines in tenant demand with no quarterly gains. This downturn was characterized by short- and long-term reductions in requirement volumes from core demand sectors, notably the finance, technology and legal sectors, which have struggled over the trailing twelve-month period. Note that the VODI tracks Boston city core, and any demand changes in Cambridge and 128 Beltway are not covered in the VODI.
decrease year-over-year
31%
Boston

Trailing behind:
Boston
�
Markets in Focus
Chicago’s office market ended the quarter at a VODI of 55. While this represents both quarterly and annual declines, a closer analysis reveals concentrated pockets of demand, particularly from professional services, finance, and legal sectors. These core demand sectors for the city are helping support current demand levels, but are not enough to drive broader demand growth.
decrease quarter-over-quarter
11%
CHICAGO
Finishing the quarter with a VODI of 65, the Seattle market experienced a slight dip from the previous quarter but maintained a trajectory of strong annual growth. Requirement demand was significantly bolstered by the sustained expansion of the tech sector over the trailing twelve months. This underlying strength presents some resilience, even as the broader national labor market shows signs of cooling.
decrease quarter-over-quarter
6%
SEATTLE
decrease quarter-over-quarter
2%
WASHINGTON, D.C.


Read VODI impacts on local markets
The first quarter of 2026 was defined by a reordering of local market performance. National averages mask a series of intensely local and disparate stories, though markets like New York and San Francisco have demonstrated strong performance with recent gains driven by sustained tech demand, augmented by a resurgence of finance activity in New York. The following table summarizes the headline performance of the seven major U.S. office markets tracked by the VODI.�
A great divergence in market fortunes
local VODI RESULTS
LOCAL
The current oil shock reveals a resilience that stands in contrast to previous disruptions. Unlike the 2023 Silicon Valley Bank crisis, which triggered double digit uniform declines in office demand, the current landscape is fragmented. While the 2025 Trade War introduced short-term moderate, widespread volatility, office demand rebounded as tech demand surged.
A contracting labor market for office users typically dampens office demand. Conversely, it also strengthens employers' leverage on remote work policies, potentially allowing firms to mandate more on-site work and thus offset demand reduction. Any potential growth in return-to-office (RTO) trends, however, may face a challenge from elevated short-term energy costs resulting from the oil price shock tied to the Iran War.�


The New York market demonstrated significant strength this quarter, concluding with a VODI of 91. This figure is comfortably aligned with its pre-pandemic average from 2018-2019, showcasing the market's resilience even amid recent geopolitical instability and heightened risks from a cooling labor market.
�Volumes expanded, driven primarily by finance and legal, traditional core sectors that had contracted substantially in the second half of 2025. Complementing this core industry growth is the sustained expansion of technology and AI firms establishing a presence in the city.
quarterly increase
17%
New York

The Los Angeles market achieved a VODI of 72. The market registered quarterly improvements in demand, driven largely by a discernible uptick in requirements from the legal and creative sectors. The growth in the creative sector was notable, given its outsized importance to the local market, as demand reached its highest point since Q2 2024. This growth may have been driven in part by California's recent expansion of film tax credits for the region.
quarterly increase
20%
Los Angeles
A 124 percent year-over-year increase in demand pushed San Francisco to a VODI of 114 this quarter, making it the only tracked market to exceed pre-pandemic levels. This strong overall performance was heavily anchored by robust, broad-based growth in technology and AI demand, spanning various tenant size brackets. That breadth across size brackets is reflected in the requirement count, which is reaching post-pandemic highs. CB Insights data shows 69 percent of AI company funding deals in Q4 2025 involved firms with fewer than 50 employees, even as major labs continue to take down large blocks of space.
quarterly increase
70%
SAN FRANCISCO
Starting 2026 strong:
San Francisco, New York, and Los Angeles
Markets in Focus


PREVIOUS
Through Q1 2026, technology accounted for the bulk of national demand growth, with year-over-year demand rising 109 percent. Although, finance and legal saw strong momentum to start 2026 with quarterly gains of 54 and 41 percent respectively, outpacing technology in the quarter.


NEXT


Read more
Read more
Read more
Read more
Read more
Pre-Pandemic
The Reset
The Crash
The Recovery
The Trough
New demand for office space �over the pandemic: An illustration
Is demand �finally thawing?
After October 2021, the VODI seemed almost stagnant. It eventually bottomed out at the end of 2022 and has been gradually recovering since then.
The Recovery


After vaccines were introduced in early 2021 a sense of return-to-normalcy pervaded. Nationally, the VODI rose from 33 in January 2021 to 85 in June 2021, as demand that had been waiting on the sidelines during The Trough entered the market all at once in a short period. Once that pent-up demand was spent, the VODI quickly subsided.
The Reset

From June 2020 through the end of that year, new office demand generally remained very low. In some cities, such as Boston, Chicago and Washington, D.C., the VODI remained more or less flat during this period. In others, such as San Francisco and Seattle, and most notably in New York City and Chicago, this period saw new office demand begin to recover, foreshadowing the phase that was to follow.
The Trough

In Spring 2020 new office demand fell sharply to the “pandemic low.” Nationally, the VODI fell from 84 in March 2020 to 12 in June 2020, a decline of 86 percent. In some cities the sharp fall was followed by a quick v-shaped rise (New York City and Los Angeles); In others, there was a prolonged u-shaped trough (Washington, San Francisco, Boston, Chicago, and Seattle).
The Crash

From January 2018 to March 2020, new office demand fluctuated around a level of 100. In some cities, there was a noticeable downward trend in advance of the pandemic: Chicago, Los Angeles, Seattle; in the other cities the VODI was more ambiguous as to whether it was flat or slightly upward trending.
Pre-Pandemic

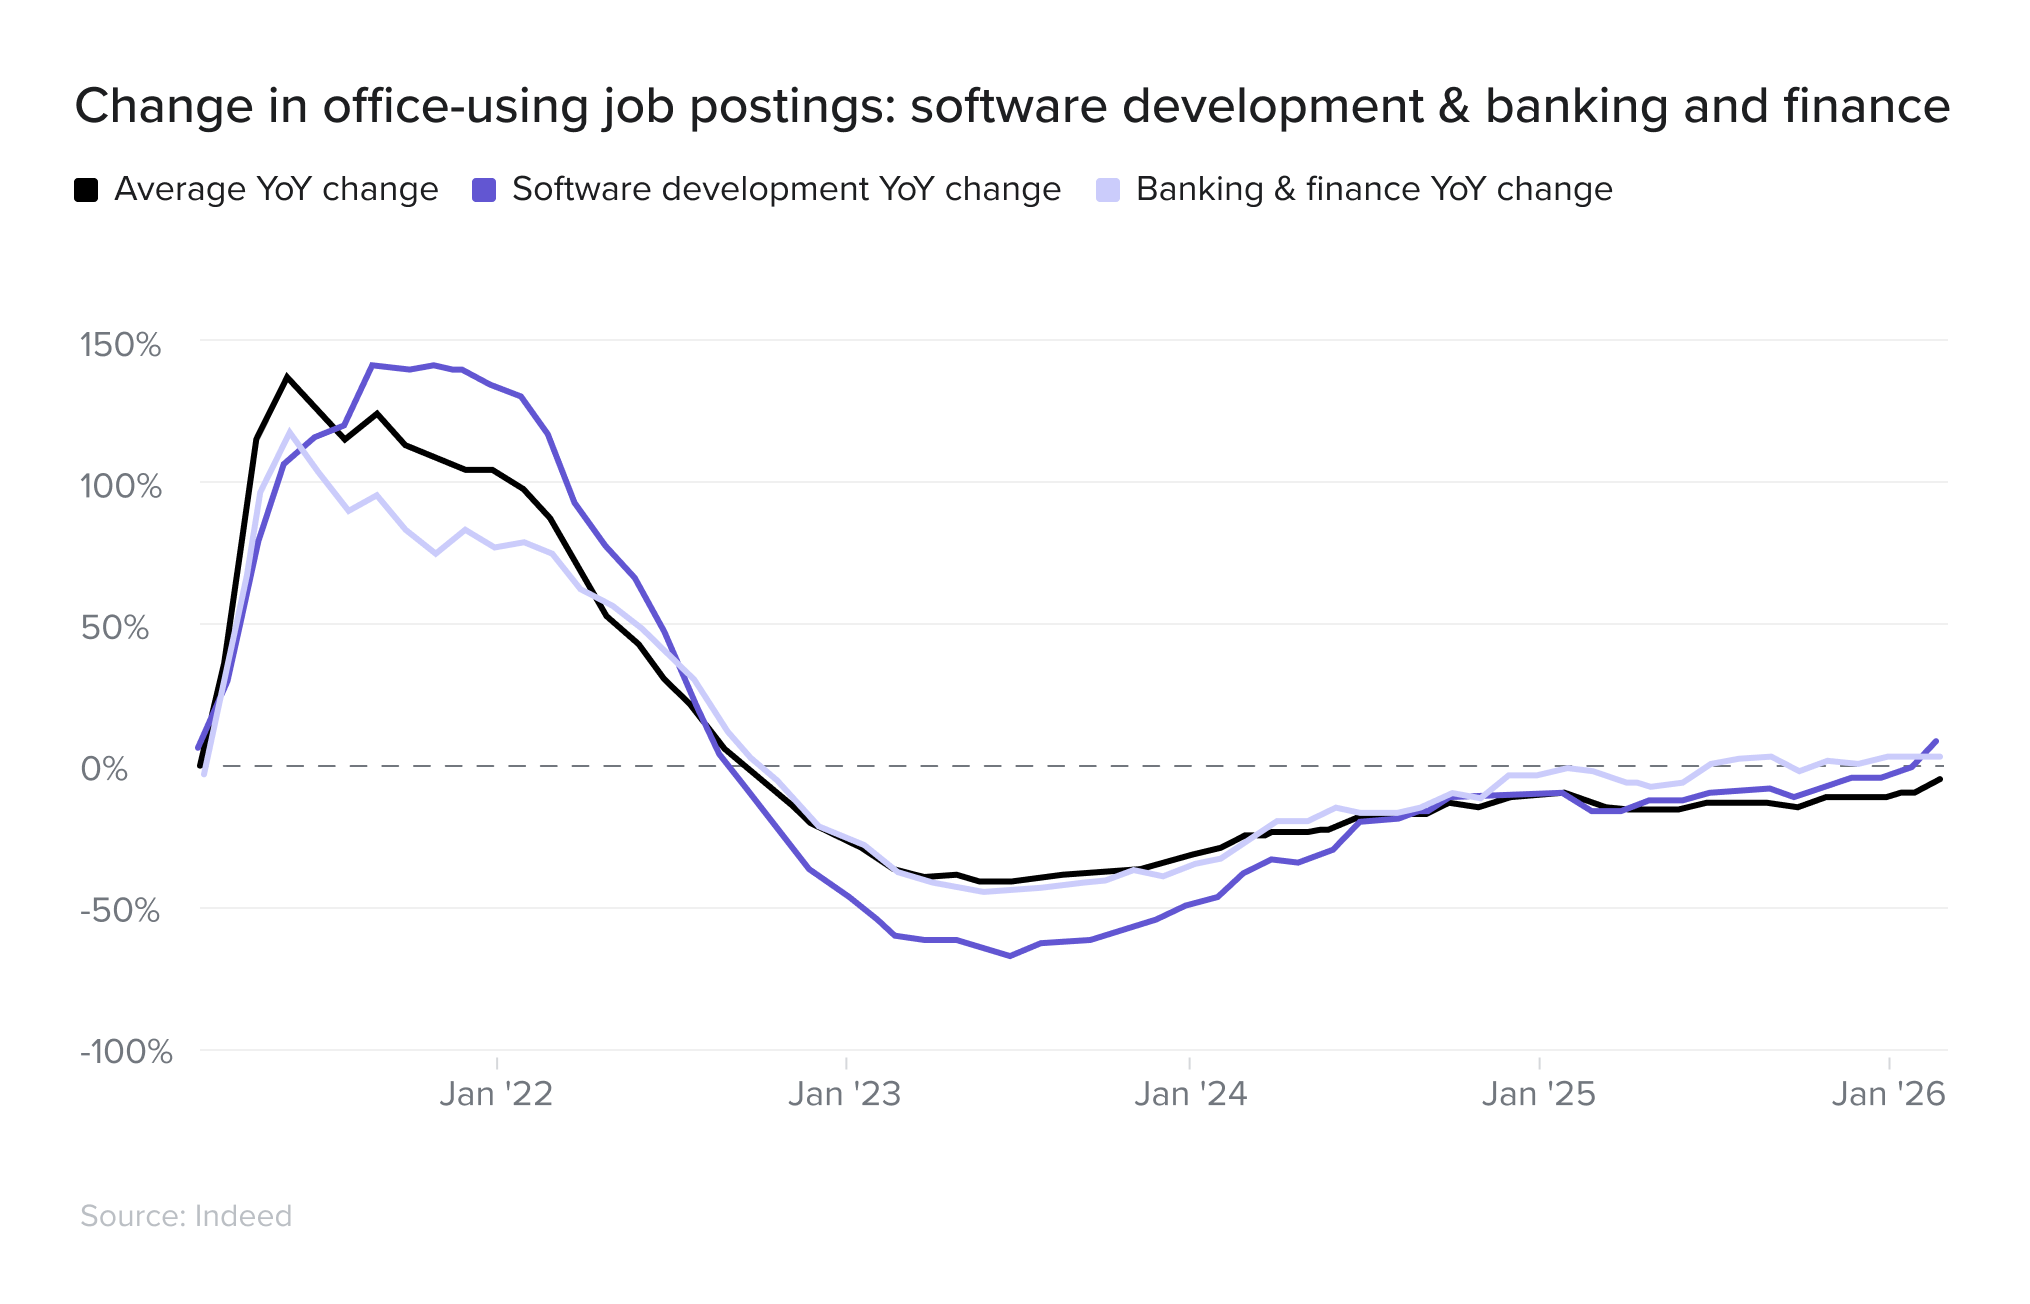
However, a more detailed look at specific roles through Indeed’s HiringLab suggests certain office-using occupations are still robust. Software developer postings, for example, were up 12 percent year-over-year in February 2026, and both software development and banking and finance roles have grown faster than other office-using positions over the last twelve months.�
This strength in office demand is also notable particularly given the concurrent cooling of the labor market for office-using occupations. In the first quarter, total office-using employment declined 0.2 percent, for a loss of 58,000 jobs. Job opening rates have also softened nationally according to the Bureau of Labor Statistics’ JOLTS data. Specifically, the job opening rate in the information sector fell to 3.25 percent in Q1 2026 from 3.83 percent a year prior; openings in finance and real estate also declined.
�

The VTS Office Demand Index (VODI) reached its highest post-pandemic level in Q1 2026, finishing the quarter at 79. This represents an 18 percent increase from Q4 2025 and a 13 percent year-over-year gain. With seasonal early-year demand growth holding on trend, March gains were in line with historical norms despite broader headwinds. The 12-point gain from December to March was the second largest non-lockdown-recovery seasonal jump in the post-pandemic period, trailing only the December 2022 to March 2023 gain of 15 points.�
Explore nationwide trends
Resilience amid uncertainty – for now
NATIONAL VODI RESULTS
NATIONAL
A contracting labor market for office users typically dampens office demand. Conversely, it also strengthens employers' leverage on remote work policies, potentially allowing firms to mandate more on-site work and thus offset demand reduction. Any potential growth in return-to-office (RTO) trends, however, may face a challenge from elevated short-term energy costs resulting from the oil price shock tied to the Iran War.�

VTS is the leading provider of leasing, marketing, asset management, and tenant experience software for commercial real estate landlords, with market share averaging over 80% in core U.S. office markets. The VTS platform captures, aggregates, and anonymizes supply and demand data across all office asset classes and age segments. Due to VTS’ market share and the multiple spaces considered by tenants in a given search, VTS sees 99% of all newly created tenant requirements within the markets it serves. With this unprecedented view, VTS has developed an index, the VTS Office Demand Index, published monthly, to provide landlords, brokers, tenants, and the business community with visibility into a previously opaque segment of the market: real-time tenant demand in the US office leasing market.
The VTS Office Demand Index (VODI) is the earliest look into the health of the office market. The VODI, as an index capturing actual market actions of potential tenants - promises to be a source of greater certainty and the first to actually capture the demand for office space as it evolves during this critical period.
The VODI reflects the total square footage of unique tenant requirements surfaced by touring activity in a given month relative to the total square footage observed in VTS’ expansive network of leasing, marketing, and asset management software. Accounting for the total square footage observed helps distinguish changes in the demand for office space from the growth of VTS’ reach, as well as from changes in the supply of office space, e.g. due to fluctuation in vacancy rates or new construction.
�To enhance its interpretation and its comparability across regions, VODI is reported as an indexed value using the 2018-2019 average level as a baseline valued at 100. The index is not seasonally adjusted, but it is smoothed using a 3-month trailing average.
To ensure the viability of VTS data for market insight, VTS suppresses monthly VODI data points informed by less than four customers, as well as all data aggregated prior to January 2018.
The markets referred to in this report correspond to the named cities, not metropolitan areas.
VIEW FULLSCREEN

METHODOLOGY

VTS Office Demand Index (VODI)


ERIC JOHNSON
VTS
eric.johnson@vts.com
Media Contact
April 2026
Copyright View the Space, Inc. 2026
BACK TO TOP
READ REPORT
Changes to the VODI Report

VTS has shifted the cadence of the VODI report from monthly to quarterly and is retiring its standalone Greenshoots Report. The March 2023 VODI report was the final monthly report. The quarterly VODI report will be published in January, April, July, and October capturing data and findings from VTS over a three-month (quarterly) period moving forward. The quarterly VODI report will include select data points from the former VTS Greenshoots report, providing all your need-to-know trends and takeaways for the office market in one comprehensive report.
For questions, data inquiries or to connect with a VTS spokesperson, contact eric.johnson@vts.com.
Join us
BOOK A DEMO
BACK TO REPORT